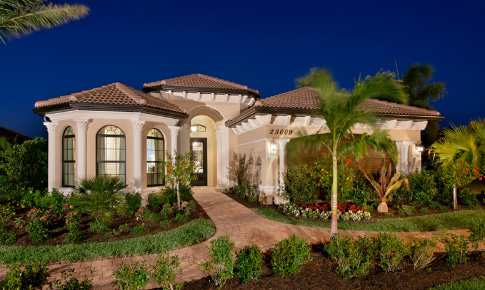

Bonita Lakes Executive Collection by Toll Brothers – photo: tollbrothers.com
Home sales in the Naples area increased 3 percent in November year over year, according to the November 2017 Market Report released by the Naples Area Board of REALTORS®. The report also showed heightened activity in the single-family home market in November where sales of properties priced above $300,000 increased by double digits. Local brokers analyzing the Market Report said they were pleased with the high-end market’s closed sales activity in November, which experienced a 21 percent increase in single-family home sales and a 22 percent increase in condominium sales in the $2 million and above price category.
“November was a good month for both buyers and sellers,” said a local Broker. “Sellers are pricing homes to sell and there were 521 homes sold in the month of November despite the effects of Hurricane Irma. This is only 51 fewer homes than sold in November 2016.”
These observations were also recognized by other Brokers who said, “Buyers and sellers have good reason to be confident as there are many positives on both sides of the fence. Sellers should get their properties on the market now and buyers should move quickly as multiple offers could occur as a result of the tight inventory.”
The November Market Report showed the overall median closed price rose 9 percent to $330,000 compared to $303,000 in November 2016, and overall pending sales in November increased 2 percent to 728 compared to 713 last year. More impressively, pending sales for homes valued at $1 to $2 million increased by 30 percent in November to 61 from 47 last November.
There were 116 cash transactions for properties below $300,000 in November. This was higher than expected and may indicate the return of investors to the market.
The report also showed that a 12 percent decrease in single-family inventory during November led to a subsequent 9 percent increase in the market value of single-family homes. The Naples Beach area saw a 28 percent increase in its median closed price to $975,000 from $762,000 in November 2016.
The luxury market has gone wild. November had a 63 percent increase in pending sales for single-family homes over $1 million. This is a clear indication that high-end buyers continue to find Naples a desirable location for investment.
As pointed out by Cindy Carroll, SRA, with the real estate appraisal and consultancy firm Carroll & Carroll, Inc., the November report showed a high concentration of condominiums available in the $300,000 and below price category (1,228). “Even though they appear to be a more affordable option, condominiums often have obstacles during the buying process like 55 and older age restrictions or high annual fees.”
Despite these challenges and a 2 percent decrease in inventory in November, condominiums in both the $300,000 and below and the $2 million and above price categories saw inventory rise by 4 percent.
Geographically, sales activity for single-family homes in the North Naples market is heating up as evidenced in the 21 percent increase in pending sales during November. Also hot are condominiums in the Naples Beach area, which saw an 11 percent increase in pending sales during November.
The tax reform proposals coming out of Washington, D.C., appear to present negative tax consequences for many people living in states with high state income tax burdens. This may make relocation to Florida even more attractive in 2018, especially to the wealthy since Florida does not impose an individual income tax.
Contact David at 239-285-1086 or David@DavidFlorida.com for additional information, to find a home in Naples, Bonita Springs, Marco Island.

 Posted by RT | Nov 30, 2017 | RT Blog, Trends
National inventory levels predicted to see positive growth; Las Vegas to lead the U.S. in sales and price growth
Inventory constraints that have fueled a sharp rise in home prices and made it difficult for buyers to gain a foothold in the market will begin to ease next year as part of broad and continued market improvements, according to the realtor.com® 2018 National Housing Forecast released today by the online real estate information and services destination.
The easing of the inventory shortage, which is expected to result in more manageable increases in home prices and a modest acceleration of home sales, is based on an inventory growth trend that began in August 2017, according to realtor.com®. The annual forecast, which is among the industry’s bellwethers in tracking and analyzing major trends in the housing market, also expects an increase in millennial mortgage share and strong sales growth in Southern markets. The wildcard in 2018 will be the impact of the tax reform legislation currently being debated in Congress.
“We are forecasting next year to set the stage for a significant inflection point in the housing shortage,” said Javier Vivas, director of economic research for realtor.com®. “Inventory increases will be felt in higher priced segments after home buying season, which limits their impact on total sales for the year. As we head into 2019 and beyond, we expect to see these inventory increases take hold and provide relief for first-time home buyers and drive sales growth.”
Read more on Real Trends…

 Naples, Fla. (October 27, 2017) – The Naples area housing market maintained positive traction during the Third Quarter of 2017 despite enduring a hurricane that impeded activity for three weeks in September. According to the September 2017 Market Report released by the Naples Area Board of REALTORS® (NABOR®), which track home listings and sales within Collier County (excluding Marco Island), there were 398 closed sales during the month of September, a 30 percent decrease compared to September 2016.
September proved challenging for the real estate market as homeowners and agents were forced to wait while public and utility services rebuilt or repaired infrastructure damaged by the hurricane. This was reflected in statistics released for September, which affected total outcomes for the Third Quarter of 2017. However, year-to-date numbers tell a different story as activity in pending, closed and median price categories were up year over year at the end of the quarter!
“The hurricane hit us in the right month,” said a Broker, who went on to explain that September is typically when the housing market takes a breath before it begins to intensify again. Yet despite a direct hit by a major hurricane, overall closed sales for the third quarter increased 3 percent (year over year). Not surprisingly, the storm’s short-term impact on the housing market in September only tempered sales slightly in the third quarter by 5 percent (quarter over quarter), which translated to just 86 fewer closed sales than in the third quarter of 2016.
One element the hurricane failed to harm was the continued growth in property value for Naples. Overall median closed prices in the third quarter of 2017 increased 3 percent to $320,000 compared to $312,000 in the third quarter of 2016.
The NABOR® Third Quarter 2017 Market Report provides comparisons of single-family home and condominium sales (via the Southwest Florida MLS), price ranges, and geographic segmentation and includes an overall market summary. The NABOR® Third Quarter 2017 sales statistics are presented in chart format, including these overall (single-family and condominium) findings:
|
CATEGORIES
|
3Q 2016
|
3Q 2017
|
CHANGE
|
|
Total homes under contract (pending sales) (quarter/quarter)
|
1,952
|
1,675
|
-14%
|
|
Total homes under contract (pending sales) (year/year)
|
9,045 |
9,146 |
1% |
|
Total closed sales (quarter/quarter)
|
1,889 |
1,803 |
-5% |
|
Total closed sales (year/year)
|
8,627 |
8,885 |
3% |
|
Median closed price (quarter/quarter)
|
$312,000 |
$320,000 |
3% |
|
Median closed price (year/year)
|
$318,000
|
$329,000
|
3% |
|
Median closed price >$300K (quarter/quarter)
|
$485,000 |
$498,000 |
3% |
|
Median closed price >$300K (year/year)
|
$525,000
|
$512,000
|
-2% |
|
Total active listings (inventory)
|
5,044 |
4,608 |
-9% |
|
Average days on market
|
86 |
99 |
15% |
|
Single-family closed sales (quarter/quarter)
|
1,001 |
927 |
-7% |
|
Single-family median closed price (quarter/quarter)
|
$382,000 |
$418,000 |
9% |
|
Single-family inventory
|
2,669 |
2,314 |
-13% |
|
Condominium closed sales (quarter/quarter)
|
888 |
876 |
-1% |
|
Condominium median closed price (quarter/quarter)
|
$241,000 |
$248,000 |
3% |
|
Condominium inventory
|
2,375 |
2,294 |
-3% |
“Fortunately, media in most of the core areas where our buyers come from didn’t overhype the storm, which helped obscure fears,” said Cindy Carroll, SRA, with the real estate appraisal and consultancy firm Carroll & Carroll, Inc. “This is going to be a very good history lesson for us because the hurricane hit during a time of stable market activity. By January though, I think our brush with Irma will be forgotten.”
Carroll added that sales of existing homes are poised to increase in the coming months too because much of the labor force stepped away from new construction to work for companies that provide a variety of property maintenance, including tree removal and lawn debris cleanup.
The NABOR® September 2017 Market Report provides comparisons of single-family home and condominium sales (via the Southwest Florida MLS), price ranges, and geographic segmentation and includes an overall market summary. The NABOR® September 2017 sales statistics are presented in chart format, including these overall (single-family and condominium) findings:
|
CATEGORIES
|
Sept 2016
|
Sept 2017
|
CHANGE
|
| Total homes under contract (pending sales) |
661 |
299 |
-55% |
| Total closed sales |
566 |
398 |
-30% |
| Median closed price (month/month) |
$318,000 |
$310,000 |
-3% |
| Median closed price >$300K (month/month) |
$452,000 |
$492,000 |
9% |
| Total active listings (inventory) |
5,044 |
4,608 |
-9% |
| Average days on market |
92 |
96 |
4% |
| Single-family closed sales |
301 |
173 |
-43% |
| Single-family median closed price (month/month) |
$378,000 |
$448,000 |
19% |
| Single-family inventory |
2,669 |
2,314 |
-13% |
| Condominium closed sales |
265 |
225 |
-15% |
| Condominium median closed price (month/month) |
$245,000 |
$238,000 |
-3% |
| Condominium inventory |
2,375 |
2,294 |
-3% |


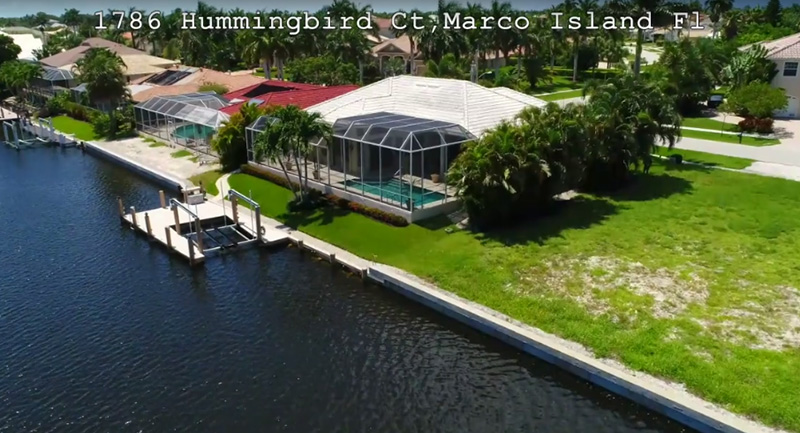
Canal-front home in Naples, Florida
REALTORS® in Naples sold more existing homes in July (682) than they did in January (603) or February (613), a statistical reality that busts an old myth that home sales stall in the summer. In fact, overall closed sales in the market’s sweet spot (homes priced between $300,000 and $500,000) increased 32 percent in July. Broker analysts reviewing the July 2017 Market Report, said a 9 percent increase in closed sales during July was very good, but the continued reduction of inventory, especially in the single-family home market, is cause for concern as it limits choices for buyers.
One segment of the market that brokers are watching closely is the $300,000 and below single-family home market, which saw pending sales decrease 24 percent, closed sales decrease 19 percent, and inventory decrease 2 percent in July. In fact, the entire single-family home market is getting stretched thin as inventory tightens. In July, inventory rose just 3 percent overall, but single family home inventory decreased 1 percent.
One local Broker noted, “The July report showed the median closed price for homes under $300,000 was the highest since 2008. However, the median closed price for homes over $300,000 was the lowest reported in 9 years!”
According to the report, overall median closed prices in July increased 6 percent to $319,000 from $300,000 in July 2016. For homes in the $300,000 and below price category, the median closed price increased only 3 percent to $225,000 from $219,000 in July 2016. And for homes above $300,000, the median closed price decreased 7 percent to $485,000 from $524,000 in July 2016.
Brokers are optimistic that the third quarter closed sales will finish ahead of the second quarter, and pointed to activity in the $500,000 to $1 million price category, which saw the overall pending sales increase 44 percent in July from July 2016.
For months, broker analysts and NABOR® have warned against setting unrealistic pricing, a strategy that can hurt a homebuyer because a home is often overlooked if it’s overpriced.
High prices are a strategy that can work in an accelerating market, but it’s risky. A home might sit for months without an offer and sellers typically end up marking the price down, perhaps lower than it should have sold for in the first place. A licensed REALTOR® uses real-time MLS data that can help a seller hit the sweet spot when setting the listing price: a price that’s high enough to reflect the home’s value, but attractive enough to gain buyer attention and get it sold quickly.
Another segment that brokers are watching closely is the number of days on the market it takes for a property to sell, which is on the rise and hit 105 days in July. One reason for this could be cosmetic. According to Brenda Fioretti, Managing Broker at Berkshire Hathaway HomeServices Florida Realty, “Many homebuyers are looking for a coastal, contemporary look, not the Mediterranean or Tuscan look that dominates much of the existing home market and appears dated. Sellers must either consider making renovations to meet the light, coastal look buyers want or reducing the home’s price in order to stay competitive with the new construction product that reflects this new coastal, contemporary style.”
“Because inventory dropped 1 percent in the single-family home market in July, this may be the first sign that we are not far from a shift in the market,” said Cindy Carroll, SRA, with the real estate appraisal and consultancy firm Carroll & Carroll, Inc., who went on to add, “the housing market is cyclical, and the rate of inventory increase has been trending down since December. If this behavior continues and we go below our lowest inventory point (3,563), which was in July 2014, I predict we’ll shift from a buyer’s to a seller’s market and probably start to see prices increase again.”
If you are weighing the pros and cons of buying or selling a home in the coming months, let me be your guide. I can help you do a market comparison and determine a fair and reasonable listing price. I can also identify properties best suited for your needs and negotiate a purchase price that fits your budget. I would be my honor to assist you and your friends and family with your real estate needs. Please contact me at (239) 285-1086 or email David@davidforida.com
 Naples, Fla. (June 16, 2017) – Record-breaking rain fall in June did not dampen buyer interest in the Naples housing market as evidenced in the Second Quarter and June 2017 Market Reports released by the Naples Area Board of REALTORS® (NABOR®), which track home listings and sales within Collier County (excluding Marco Island). The 2Q report showed strong and steady sales activity leading into summer with a 7 percent increase in overall closed sales to 2,880 closed sales in 2Q 2017 from 2,704 closed sales in 2Q 2016, and a 9 percent increase in overall closed sales for the month of June to 907 closed sales from 832 closed sales in June 2016.
There were many remarkable areas of activity in the 2Q Market Report. For example, condominiums in the $2 million and above price category saw an 86 percent increase in closed sales and a 38 percent decrease in median closed price in 2Q 2017 from 2Q 2016. Similarly, pending sales (homes under contract) in the North Naples market increased 20 percent during 2Q 2017 from 2Q 2016, and was the only geographic area that reported a decrease in median closed price (-1 percent).
As reflected in the 2Q Market Report, pending sales of condominiums in North Naples increased 30 percent to 428 condominiums in 2Q 2017 from 329 condominiums in 2Q 2016. Closed sales of condominiums in North Naples increased 29 percent to 463 condominiums in 2Q 2017 from 358 condominiums in 2Q 2016. Condominium sales moving into summer look very good for North Naples too as June’s Market Report showed a 30 percent increase in pending sales.
Overall inventory during the 2Q of 2017 rose a respectable 4 percent to 5,189 homes in 2Q 2017 from 4,983 homes in 2Q 2016. This is very evident in the Report for homes in the $2 million and above price category, which only saw a 1 percent increase in inventory, yet a 43 percent increase in closed sales.
Despite a 12 percent increase in inventory for the $300,000 and below price category, there was a 4 percent decline in overall closed sales in this low-end price category. Interestingly, while inventory for condominiums in the $300,000 and below price category saw the highest increase (17 percent) in the 2Q of 2017, the number of closed sales for condominiums in this category did not change quarter over quarter.
The NABOR® Second Quarter 2017 Market Report provides comparisons of single-family home and condominium sales (via the Southwest Florida MLS), price ranges, and geographic segmentation and includes an overall market summary. The NABOR® 2Q 2017 sales statistics are presented in chart format, including these overall (single-family and condominium) findings:
|
CATEGORIES
|
2Q 2016
|
2Q 2017
|
CHANGE
|
|
Total homes under contract (pending sales)
|
2,541
|
2,770
|
9%
|
|
Total closed sales
|
2,704 |
2,880 |
7% |
|
Median closed price
|
$325,000 |
$340,000 |
5% |
|
Median closed price >$300K
|
$540,000 |
$535,000 |
-1% |
|
Total active listings (inventory)
|
4,983 |
5,189 |
4% |
|
Average days on market
|
76 |
97 |
28% |
|
Single-family closed sales
|
1,263 |
1,349 |
7% |
|
Single-family median closed price
|
$421,000 |
$418,000 |
-1% |
|
Single-family inventory
|
2,674 |
2,654 |
-1% |
|
Condominium closed sales
|
1,399 |
1,531 |
9% |
|
Condominium median closed price
|
$259,000 |
$282,000 |
9% |
|
Condominium inventory
|
2,309 |
2,535 |
10% |
Closed sales in the $2 million and above price category are poised to remain strong through the summer as this category experienced a 30 percent increase in pending sales during the 2Q of 2017.
Broker analysts reviewing the June 2017 Market Report acknowledged that the first two weeks of June started out a little slow, but the month ended strong with 907 closed sales, up 9 percent from 832 in June 2016. Sales of condominiums on the Naples Beach took center stage in June with a 50 percent increase over June 2016. June’s pending sales activity may set the tempo for a promising summer, as pending sales increased 16 percent in June 2017 from June 2016.
The NABOR® June 2017 Market Report provides comparisons of single-family home and condominium sales (via the Southwest Florida MLS), price ranges, and geographic segmentation and includes an overall market summary. The NABOR® June 2017 sales statistics are presented in chart format, including these overall (single-family and condominium) findings:
|
CATEGORIES
|
JUNE 2016
|
JUNE 2017
|
CHANGE
|
|
Total homes under contract (pending sales)
|
720 |
837 |
16% |
| Total closed sales |
832 |
907 |
9% |
| Median closed price |
$315,000 |
$325,000 |
3% |
| Median closed price >$300K |
$521,000 |
$499,000 |
-4% |
| Total active listings (inventory) |
4,983 |
5,189 |
4% |
| Average days on market |
82 |
97 |
18% |
| Single-family closed sales |
421 |
434 |
5% |
| Single-family median closed price |
$400,000 |
$404,000 |
1% |
| Single-family inventory |
2,674 |
2,654 |
-1% |
| Condominium closed sales |
420 |
473 |
13% |
| Condominium median closed price |
$243,000 |
$263,000 |
8% |
| Condominium inventory |
2,309 |
2,535 |
10% |
At the end of June 2017, the Naples market contained 7.86 months of inventory, which is considered to be normal, indicating that the June market is neither a sellers’ nor a buyers’ market. Inventory has not been this robust for the month of June since 2011.
Naples Area Board of REALTORS® Economic Summit Experts Predict Naples Area Market Prime for Growth
Naples, Fla. (May 11, 2017) – More than 400 REALTORS® and real estate professionals interested in the economic health of Collier County attended the Naples Area Board of REALTORS® (NABOR®) 2017 Economic Summit, “The New Future: A View from the Top,” on Wednesday, April 26, 2017 at the Hilton Naples. Three industry experts provided national, state, and local analysis of recent and future growth projections in home sales and business growth activity as well as predictions on what to anticipate from lending institutions and federal regulators in the next 12 months. (see gallery of photos below)
“It looks like we turned a corner,” said Cindy Carroll, SRA, with the real estate appraisal and consultancy firm Carroll & Carroll, Inc., who presented a detailed analysis and comparative review of local housing sales activity. “In the last 12 months we’ve seen inventory increase 23 percent, but that is lower than the previous year, which saw a 35 percent increase. Our inventory may be slowing, but we still have an eight month supply of homes for sale.” Carroll considers a 12-month supply of homes in Collier County a balanced market.
With decades of experience that builds on a family legacy in the real estate appraisal business, Carroll combined her earned wisdom with data collection from the First Quarter 2017 Market Report released by the Naples Area Board of REALTORS® (NABOR®), which tracks home listings and sales within Collier County (excluding Marco Island), and reports generated from the Southwest Florida Multiple Listing Service (MLS), to ascertain a long-view of market behaviors. During her presentation, she shared a surplus of data from these reports and her own conclusions including:
- The Crayton/Moorings Park/Coquina/Park Shore area is saturated with new construction speculative home projects that have resulted in a 2.94 years supply of this type of home in this area;
- The $0 to $300,000 segment of the condominium market makes up 47% of the total condominium inventory. Overall condominium inventory is up across the board geographically with the greatest increase showing up in the North, Central and South regions; and
- That 58 percent of the active listings located in the Golden Gate Estates area off Everglades Boulevard and north and south of Golden Gate Boulevard are priced at or below $300,000.
Next to take the stage was Mark Strain, Chairman of the Collier County Planning Commission, who immediately engulfed the audience with county growth projections and proposed redevelopment and housing expansion plans. Strain’s data was extrapolated from government databases and provided an overarching look at the county’s framework for growth.
“We are wealthiest county in Florida with an average per capita income of $78,000,” said Strain. “Our population has increased over 10.7 percent between the years 2010 to 2016. At this rate, we will reach maturation in the year 2030.”
An audible gasp was heard from the audience when he revealed that 32 residential developments were approved in the last year, amounting to an additional 4,182 new lots for sale. He also reported 76 new commercial developments approved in 2016, and 56 senior living facilities currently existing with an additional 13 planned but not yet built.
“The Immokalee Road/I-75 and Collier/US 41 corridors are the fastest growing areas in the county,” added Strain. “And a recent request to change the building height limits at the entry to the City of Naples may produce some rapid new construction, as laid out in an ambitious redevelopment plan for the Gateway Triangle area.”
Rounding out his presentation, Strain shared with the audience that Collier County has one of the lowest crime rates in the state despite its rapid population growth (Collier saw a 5 percent reduction in crime in 2015 followed by a 7.8 percent reduction in 2016). Also, as we continue to grow there are over a dozen additional schools planned at all grade levels throughout the critical growth areas of the county.


