

Click to enlarge infographic.
Naples, Fla. (September 14, 2018) – Closed sales of properties during August increased 5 percent to 719 homes from 685 homes in August 2017 according to the August 2018 Market Report released by the Naples Area Board of REALTORS® (NABOR®), which tracks home listings and sales within Collier County (excluding Marco Island). Inventory during August also rose by 2 percent and was driven by a surge of 218 more properties added to the market in the two lowest price categories reported, compared to August 2017.
As to whether heightened Red Tide activity affected the Naples housing market in August, a Broker, responded by stating, “There were only 14 fewer pending sales in August compared to last year. And remember, we are still working with only 11 months of data since Hurricane Irma essentially halted activity for nearly a month last year.”
Overall pending sales in August fell 3 percent; but pending sales of condominiums in the $500,000 to $1 million price range soared 28 percent in August. And pending sales for single family homes above $300,000 increased as well, with an impressive 62 percent increase for single family homes in the $2 million and above price category.
The NABOR® August 2018 Market Report provides comparisons of single-family home and condominium sales (via the Southwest Florida MLS), price ranges, and geographic segmentation and includes an overall market summary. The NABOR® August 2018 sales statistics are presented in chart format, including these overall (single-family and condominium) findings:
|
CATEGORIES
|
August
2017
|
August 2018
|
CHANGE
|
|
Total homes under contract (pending sales) (month/month)
|
829
|
806
|
-3%
|
|
Total closed sales (month/month)
|
685 |
719 |
+5% |
|
Median closed price (month/month)
|
$328,000 |
$319,000 |
-3% |
|
Median closed price >$300K (month/month)
|
$510,000 |
$446,000 |
-13% |
|
Total active listings (inventory)
|
4,807 |
4,913 |
+2% |
|
Average days on market
|
95 |
120 |
+26% |
|
Single-family closed sales (month/month)
|
378 |
348 |
-8%
|
|
Single-family median closed price (month/month)
|
$422,000 |
$405,000 |
-4% |
|
Single-family inventory
|
2,446 |
2,560 |
+5% |
|
Condominium closed sales (month/month)
|
307 |
371 |
+21% |
|
Condominium median closed price (month/month)
|
$250,000 |
$250,000 |
0% |
|
Condominium inventory
|
2,361 |
2,353 |
0% |
Overall median closed prices fell 3 percent in August to $319,000 from $328,000 in August 2017, and it fell 13 percent for properties above $300,000 to $446,000 from $510,000 in August 2017. The only place prices increased was in the $500,00 to $1 million condominium market, which saw a 13 percent increase to $672,000 from $595,000 in August 2017.
Geographically, the median closed price increased 16 percent for homes in the South Naples area. This increase was reflected in a combined 37 percent increase in the single-family home market and 21 percent increase in the condominium market.
If you are looking to sell a home in Naples, email David Critzer,, or call him at 239-285-1086. David is a REALTOR® who has the experience and knowledge to provide an accurate market comparison so you can determine the right asking price. David can also ensure your next purchase in the Naples area is a success.
The term REALTOR® is a registered collective membership mark which identifies a real estate professional who is a member of the National Association of REALTORS® and who subscribe to its strict Code of Ethics.

 Bonita Springs, FL | August 27, 2018 —— According to the Bonita Springs-Estero REALTORS® (BER) Media Committee, pending sales saw an uptick in July 2018 compared to July 2017. “The number of price repositions in July has affected approximately 33 percent of pending sales,” stated a Bonita Springs Broker. In July 2018, there were 265 price repositions for combined single-family homes and condominiums. This number represents approximately 20 percent of active listings that were re-priced to represent the current market value. Area brokers agree that the continuation of price repositions will increase through the month of August 2018, causing pending sales to increase as well.
Appraisal activity in the area has also remained steady for this time of year. Julie Ross, appraiser with Carroll and Carroll Real Estate Appraisers and Consultants, stated, “The number of appraisals that took place in Bonita Springs and Estero in July 2018 is historically normal for the summer season.”
According to Realtor.com, there were almost 8 million search result page views in the Bonita Springs and Estero markets for the month of July 2018, which is approximately 1 million views over June 2018. “We know buyers will continue to look at Bonita Springs and Estero because it is an amazing value compared to other neighboring cities in Southwest Florida,” stated BER President and Area Broker, Joe Pavich, Sr.
Inventory for both single-family homes and condominiums in July 2018 was 1,362 units versus 1,389 units this time last year, which is a less than 1 percent decrease. The average days-on-market has also remained steady with just a 4 percent decrease over July 2017.
Overall, the Bonita Springs and Estero markets showed a 43 percent increase in pending units and a 13 percent increase in sold units for July 2018 versus the same time last year, and the median price is $375,000 for July 2018 versus $325,000 in July 2017. Additionally, the supply of available home inventory is higher in Bonita Springs and Estero than the national average, which sits at just 4.3 months.
The Bonita Springs-Estero REALTORS® July 2018 Report shows these overall findings for both single family and condominiums combined.
| Month over Month 7/2017 |
|
Month over Month7/2018 |
|
% Change |
|
|
|
|
|
|
|
|
|
| Pending Sales Units |
|
106 |
|
152 |
|
43 |
|
| Closed Sales Units |
|
127 |
|
143 |
|
13 |
|
| Median Closed Price |
|
$325,000 |
|
$375,000 |
|
15 |
|
| Average Days on Market |
|
91 |
|
87 |
|
-4 |
|
|
|
12-Month Ending7/2017 |
|
12-Month Ending7/2018 |
|
% Change |
|
|
|
|
|
|
|
|
|
| Pending Sales Units |
|
1,773 |
|
1,771 |
|
0 |
|
| Closed Sales Units |
|
1,790 |
|
1,676 |
|
-6 |
|
| Median Closed Price |
|
$355,000 |
|
$365,000 |
|
3 |
|
| *Active Inventory |
|
1,389 |
|
1,362 |
|
>1 |
|
| *Current Avg Month’s Supply |
|
9.3 |
|
9.8 |
|
>1 |

Click image to enlarge.
According to the National Association of REALTORS July market report, existing home sales in America decreased for the third straight month as a result of the severe housing shortage that is not releasing its grip on the nation’s housing market.
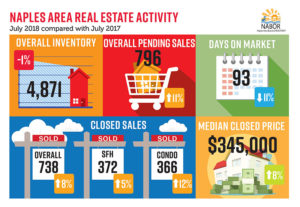
Conversely, homes sales in the Naples area were up 8 percent in July according to the July 2018 Market Report released by the Naples Area Board of REALTORS which tracks home listings and sales within Collier County. The nation has only a 4.3-month supply of home inventory, while Naples has a healthier 6.25-month supply of inventory.
“The Naples area overall median home price increase in July 2018 seems to be the only statistical category where we match national trends,” said a local Broker, “Naples saw an 8 percent increase in its overall median closed price in July 2018 compared to July 2017; whereas nationally, median closed prices went up just 4 percent. But median closed prices for properties over $300,000 in the Naples area decreased 2 percent in July 2018 compared to July 2017.”
Interestingly, while July’s overall inventory fell 1 percent to 4,871 properties from 4,928 properties in July 2017, inventory increased 5 percent in the $300,000 and below price category. In fact, inventory for single-family homes in this price category jumped 21 percent in July to 345 from 286 in July 2017.
“There are 1,154 single family homes and 1,722 condos for sale under $500,000 currently,” said Brenda Fioretti, Managing Broker at Berkshire Hathaway HomeServices Florida Realty. “Economists predict home sales in America during 2018 will not be as good as 2017. However, we’re seeing the opposite in the Naples area. Granted our sales were hampered by a hurricane in 2017, but there are no signs that interest in buying a home in Naples this year might drop because of temporary climate or environmental phenomena. We have a healthy inventory, an increase in closed sales, price stability and a decrease in the days on the market compared to July 2017.”
July also saw a huge 39 percent jump in condominium closings in the Naples Beach area. Closed sales for August look strong too in this segment as pending sales for condominiums in the Naples Beach area increased 55 percent in July 2018 over July 2017!
Overall pending sales in Naples were up 11 percent in July, with only one price segment ($500k-$1M) reporting a decrease compared to July 2017.
“Pending sales for luxury condominiums [$2 million and above] in July were up 150 percent,” said another local Broker. “The strength of the luxury market segment for both single family and condos continued into the summer months, a reflection of sustained confidence among the affluent witnessing the longest economic expansion cycle in the nation’s history and record corporate earnings.”
How buyers are purchasing homes in Naples is very different than the national average home buyer, as well. Cash sales accounted for only 20 percent of home purchases in July nationally. But in Naples, cash sales accounted for 50 percent of all home sales in July.
The NABOR® July 2018 Market Report provides comparisons of single-family home and condominium sales (via the Southwest Florida MLS), price ranges, and geographic segmentation and includes an overall market summary. The NABOR® July 2018 sales statistics are presented in chart format, including these overall (single-family and condominium) findings:
| CATEGORIES |
July 2017 |
July 2018 |
CHANGE
(percentage) |
| Total homes under contract (pending sales) (month/month) |
720 |
796 |
+11 |
| Total closed sales (month/month) |
682 |
738 |
+8 |
| Median closed price (month/month) |
$319,000 |
$345,000 |
+8 |
| Median closed price >$300K (month/month) |
$485,000 |
$474,000 |
-2 |
| Total active listings (inventory) |
4,928 |
4,871 |
-1 |
| Average days on market |
105 |
93 |
-11 |
| Single-family closed sales (month/month) |
354 |
372 |
+5 |
| Single-family median closed price (month/month) |
$409,000 |
$435,000 |
+6 |
| Single-family inventory |
2,552 |
2,542 |
0 |
| Condominium closed sales (month/month) |
328 |
366 |
+12 |
| Condominium median closed price (month/month) |
$248,000 |
$255,000 |
+3 |
| Condominium inventory |
2,376 |
2,329 |
-2 |
According to Cindy Carroll, SRA, with the real estate appraisal and consultancy firm Carroll & Carroll, Inc., inventory in neighborhoods west of US 41 are beginning to tighten. “I think we can expect some upward price pressure in areas where the inventory supply level is below 4 months, like Pelican Bay.”
Carroll also noted that the number of affordable homes in areas like Golden Gate City and South Naples is growing. “In April 2018, Golden Gate City had a 1.3-month supply of inventory; today it’s at a 3.7-month supply. While a majority are priced on the high end of the $0-$300,000 price category, it might still provide some new opportunities for first-time homebuyers.”
In response to the question of whether home sales will be affected by a longer-than-average red tide occurrence, one local Broker responded, “Clearly it’s a situation we are all watching closely, yet currently there’s no reflection in the pace of home sales. While impossible to ignore if at the beach on a day in which it’s more prominent, a block or two east you wouldn’t be aware of any issue and inland sales represent the vast majority of all activity in the market.”
It would be my honor to assist you and your friends and family with your real estate needs. If you are looking to sell a home in Naples, I have the experience and knowledge to provide an accurate market comparison so you can determine the right asking price. I can also ensure your next purchase in the Naples area is a success.

Naples, Fla. (July 13, 2018) – Activity in the Naples area housing market during the Second Quarter of 2018 remained steady in comparison to activity during the Second Quarter of 2017. According to the 2Q 2018 Market Report released by the Naples Area Board of REALTORS® (NABOR®), which tracks home listings and sales within Collier County (excluding Marco Island), overall closed sales increased 2 percent to 2,926 properties in the 2Q of 2018 from 2,880 in the 2Q of 2017. But in the $2 million and above single-family home market, closed sales rose 25 percent in the 2Q of 2018, which-along with other market indicators-leads many broker analysts to believe that interest in luxury homes will remain in high demand.
Available inventory at the end of the 2Q of 2018 was 5,165 properties, just 24 units behind the inventory level at the end of the 2Q of 2017 (5,189 properties). “This tells me that homes are coming onto the market at the same rate we are selling them,” said a Broker.
Inventory rose 15 percent in the $2 million and above condominium market during the 2Q of 2018, which may be a factor in the uptick of pending sales in the luxury condominium market as it rose 32 percent during the 2Q of 2018.
“Inventory in other parts of the state and nation are stretched thin, hovering between 3 and 4 months of inventory, but Naples enjoys almost 7 months of inventory,” said a Broker. “What’s even more impressive is that we have such a great selection of homes for buyers despite the recent increase in sales and still having some undergoing repairs from Hurricane Irma.”
“We are seeing a very different sales environment locally from that of 10 years ago when home sales in northern states stalled,” said another Broker. “But now that homes are moving fast up north, sales of high-end single-family homes in Naples are stronger than ever.”
“It’s hard to ignore the increase in interest for ultra-luxury properties,” said a Broker. “A $48.8 million sale for a home in Naples is impressive, but when you learn there was a second potential buyer who was considering the property you know what type of buyers are in the market.”
According to a Broker, there were four property sales over $10 million during the 2Q. “It’s possible the new tax laws are impacting people’s minds about residency and we’re benefiting from it.”
Brokers analyzing the market report agreed that multiple offers on luxury properties have risen. But whatever factor(s) is driving the increased interest, closed sales of luxury homes over $2 million are positioned to rise again as the stage has been set in the 2Q where pending sales in this price category increased 22 percent for single-family homes and 32 percent for condominiums.
The NABOR® Second Quarter 2018 Market Report provides comparisons of single-family home and condominium sales (via the Southwest Florida MLS), price ranges, and geographic segmentation and includes an overall market summary. The NABOR® Second Quarter 2018 sales statistics are presented in chart format, including these overall (single-family and condominium) findings:
The real estate market’s stability during the 2Q also extended to its median closed prices which increased only 1 percent to $345,000 in the 2Q of 2018 from $340,000 in the 2Q of 2017. However, despite increased sales in nearly every price category for properties priced above $300,000 during the 2Q of 2018, the median closed prices for properties above $300,000 decreased 5 percent!
As pointed out by a Broker, sales of single-family homes near Naples Beach and in the expanding North Naples area saw the greatest increase during the 2Q, and condominium sales in Central Naples outpaced all other home type sales during the 2Q. “According to the report, we averaged 30 transactions a day during the 2Q,” he said. “That’s good news for REALTORS® as we move into the summer months.”
|
CATEGORIES
|
2Q 2017
|
2Q 2018
|
CHANGE
|
|
Total homes under contract (pending sales) (quarter/quarter)
|
2,770
|
2,733
|
-1%
|
|
Total closed sales (quarter/quarter)
|
2,880 |
2,926 |
+2% |
|
Median closed price (quarter/quarter)
|
$340,000 |
$345,000 |
+1% |
|
Median closed price >$300K (quarter/quarter)
|
$535,000 |
$510,000 |
-5% |
|
Total active listings (inventory)
|
5,189 |
5,165 |
0% |
|
Average days on market
|
97 |
96 |
-1% |
|
Single-family closed sales (quarter/quarter)
|
1,349 |
1,395 |
+3%
|
|
Single-family median closed price (quarter/quarter)
|
$418,000 |
$449,000 |
+7% |
|
Single-family inventory
|
2,654 |
2,601 |
-2% |
|
Condominium closed sales (quarter/quarter)
|
1,531 |
1,531 |
0% |
|
Condominium median closed price (quarter/quarter)
|
$282,000 |
$270,000 |
-4% |
|
Condominium inventory
|
2,535 |
2,564 |
+1% |
The term REALTOR® is a registered collective membership mark which identifies a real estate professional who is a member of the National Association of REALTORS® and who subscribe to its strict Code of Ethics.

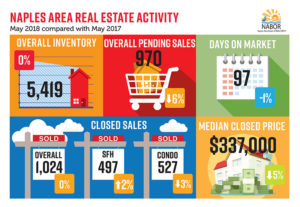 For a second consecutive year, Naples Area housing activity during May demonstrated to broker analysts that May remained a standout month. Overall closed sales were remarkable with 1,024 closed sales during May 2018 compared to 1,027 closed sales in May 2017. Closed sales in May 2018 were higher than all months following May 2017. May also saw inventory levels continue to stabilize, according to the May 2018 Market Report released by the Naples Area Board of REALTORS® (NABOR®), which tracks home listings and sales within Collier County (excluding Marco Island).
“In 2017, May’s sales increased 23 percent over sales in May 2016,” said a local Broker. “The fact that we are keeping the same pace this year and our inventory is holding steady is good news as we move into summer.”
Closed sales of properties in the $300,000 to $500,000 price category during May increased 21 percent over May 2017, while closed sales in the $300,000 and below price category were just one sale short of the number of closed sales in May 2017.
There was very good news for buyers in the report as May’s overall median closed price dropped 5 percent to $337,000 from $355,000 in May 2017. Moreover, the overall median closed price for homes priced above $500,000 decreased 14 percent to $507,000 from $590,000 in May 2017.
On the high-end side of the market, despite an 11 percent increase in median closed prices, pending sales of properties in the $2 million and above price category increased 23 percent in May 2018 compared to May 2017.
“We haven’t seen inventory levels in May this high since 2013,” said another local Broker. “I was concerned that the low end of the market would start shrinking after season, but the May report showed inventory increased 6 percent for homes under $300,000.”
Overall inventory in May rose by 15 properties compared to May 2017. The report also showed inventory rose in May for both single family homes and condominiums priced below $500,000, which accounted for 58 percent of the available market in Collier County at the end of the month.
According to another local Broker, “both median closed prices and days on market for single family homes above $300,000 decreased in May, which may indicate sellers are pricing homes to sell.”
Geographically, North Naples continues to be a shining star as the only coastal area in Collier County to report an increase in closed sales for May. Activity in the rural Ave Maria area has increased steadily over the last year; but in May, this area saw its single-family home closed sales skyrocket to 40 percent.
“Inventory levels in other areas of the nation and Florida are very tight right now, but Naples is enjoying some renewed momentum in our inventory,” said Brenda Fioretti, Managing Broker at Berkshire Hathaway HomeServices Florida Realty. “When the market is good in other areas of the country, our home sales activity is driven up as out-of-states relocate to the Naples area. I think we’ll see a very strong summer.”

 According to the April 2018 Market Report released by the Naples Area Board of REALTORS® (NABOR®), which tracks home listings and sales within Collier County (excluding Marco Island), Collier County enjoys 7.76 months of inventory compared to a 4-month supply nationally. This is great news for Naples REALTORS® as they transition from a very busy high season to what broker analysts believe will be a very strong summer.
“Summer buyers are going to be very happy this year because there will be plenty of choices,” said a local Broker. “Inventory growth has been good across all price ranges and geographic territories.”
According to Cindy Carroll, SRA, with the real estate appraisal and consultancy firm Carroll & Carroll, Inc., the rate of inventory loss is declining and she predicts the Collier housing market will become even more stable before the end of the year. Carroll considers a 12-month supply of inventory a stable market for Collier County. Nationally, a stable market is reflected as having a 6-months supply of inventory.
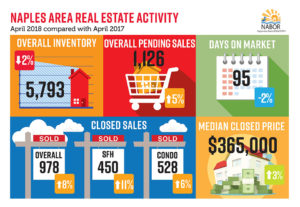
Even though April’s inventory fell 2 percent to 5,793 from 5,920 in April 2017, it’s actually rebuilding from an annual low of 4,608 properties in inventory at the end of September 2017.
“The reality is, the real estate market is doing much better this year than in 2017,” said a local Broker, considering the 2018 statistics includes the period of time when Hurricane Irma stalled home sales activity for nearly six weeks starting in September (and as reflected in the 4Q 2017 Market Report).
Condominium inventory grew 2 percent in April to 3,003 units, over half the entire market, from 2,934 units in April 2017. The $300,000 and below price category experienced the highest increase in inventory (7 percent) to 1,472 units from 1,378 units in April 2017. Pending and closed sales of condominiums in this low-end price category were also strong, with a 17 and 14 percent increase, respectively. Interestingly, the median closed price of condominiums in April dropped 8 percent to $271,000 from $296,000 in April 2017.
Carroll agreed and added, “The market for homes above $1 million is hot. If we can maintain current inventory trend levels – and I think we can – then sales of properties in this price point will be strong for at least a couple of years.”
Overall closed sales increased 8 percent (month over month) in April to 978 properties from 902 properties in April 2017. And just like the first three months of the year, the high-end of the market continued to outpace other price categories tracked by NABOR® in April. As shown in the report, the number of closed sales of homes between $1 and $2 million increased 34 percent, while closed sales of homes over $2 million increased 15 percent in April.
“Closed sales of single-family homes in April were up 11 percent with an increase in every price category except the $300,000 and below range, where there are only 300 single-family homes on the market,” said Brenda Fioretti, Managing Broker at Berkshire Hathaway HomeServices Florida Realty.
The NABOR® April 2018 Market Report provides comparisons of single-family home and condominium sales (via the Southwest Florida MLS), price ranges, and geographic segmentation and includes an overall market summary. The NABOR® April 2018 sales statistics are presented in chart format, including these overall (single-family and condominium) findings:
CATEGORIES April 2017 April 2018 CHANGE (percentage) Total homes under contract (pending sales) (month/month) 1,075 1,126 +5 Total closed sales (month/month) 902 978 +8 Median closed price (month/month) $355,000 $365,000 +3 Median closed price >$300K (month/month) $525,000 $525,000 0 Total active listings (inventory) 5,920 5,793 -2 Average days on market 97 95 -2 Single-family closed sales (month/month) 404 450 +11 Single-family median closed price (month/month) $419,000 $455,000 +9 Single-family inventory 2,986 2,790 -7 Condominium closed sales (month/month) 498 528 +6 Condominium median closed price (month/month) $296,000 $271,000 -8 Condominium inventory 2,934 3,003 +2
Geographically, real estate activity was strong across the entire county, but closed sales of single-family homes in South Naples were most remarkable with a 51 percent increase to 62 closed sales in April 2018 from 41 in April 2017.
“North Naples was also a shining star in April,” said Fioretti. “Even though inventory was down 8 percent in this geographic area, its year over year pending sales increased 9 percent, the highest of all geographic areas tracked. And its closed sales increased 13 percent year over year too.”
April’s month over month activity was even more impressive in the North Naples area, as reflected in a 26 percent increase in closed sales. Similarly, the median closed price of condominiums in North Naples dropped 14 percent in April to $258,000 from $300,000 in April 2017.


