 For August 2019, REALTOR.com reported over 9.2 million search result page views in the Bonita Springs and Estero markets, which is a 4 percent month-over-month increase. Continued buyer interest in Bonita Springs and Estero was also supported by the notable 16 percent increase in pending sales for combined single family homes and condominiums. For closed sales, August 2019 saw the strongest sales in the $1 to $2 million price segment for single-family homes. “Buyer interest in the market continues for several reasons,” stated a Broker. “Opportunities for home affordability are greater in Bonita Springs and Estero than some of our surrounding areas, which further encourages year round residents to relocate to the area, as well as new businesses.” “Additionally, the upcoming October 15th policy change regarding FHA loan approval of condominium units will also generate additional buyer interest in the condo market.”
While pending and closed sales see continued activity, buyers looking in Bonita Springs and Estero are also facing low inventory numbers, a trend that has been ongoing for several months in 2019. For single family homes and condominiums, each market segment showed more than a 24 percent decrease in inventory for August 2019 compared to this time last year. “Bonita Springs and Estero continues to be the ‘sweet spot’ between Naples and Ft. Myers,” stated a Broker.“These markets are being searched online daily and inventory levels continue to decrease as we move in the autumn buying season
For buyers looking to purchase a new construction home, there are still many choices available, but it’s critical to bring a REALTOR® on a home search in new construction communities. “When buying new construction, many buyers believe it’s a good idea to not have a REALTOR® and to use the builder representative. The thought process is that it can save them money, which is unfortunately false,” stated a Broker. “Most builders will advertise base prices and have a list of additional prices for upgrades and changes to their floor plans. A REALTOR® who has experience with new construction can help the buyer negotiate the prices of these upgrades and changes. He added, “the bottom line is that representation for the buyer in a new construction home transaction is just as important as in a resale home transaction.”
Low inventory numbers also present an opportunity for homeowners who want to sell now. “Sales and buyer interest in the Bonita Springs and Estero markets continue to be active year round as sales grow, especially in the $500K to $1 million price segments, “stated a Broker. “Homeowners who wish to sell have an opportunity to list and sell now. There is no reason to wait until January, as buyers have been looking all summer and are here now”.
Additionally, in the Bonita Springs and Estero markets, the median sales price increased 9.7 percent for single family homes, but decreased 7.5 percent for condominiums. The days on market increased 39.2 percent for single family homes and 22.7 percent for condominiums. In August 2019, there were 124 price repositions for single family homes and 91 price repositions for condominiums in Bonita Springs and Estero. The Bonita Springs-Estero REALTORS® August 2019 Report shows these overall findings for both single family and condominiums combined.
For more information and to arrange a visit to any of these luxury homes, call David at 239-285-1086 or email david@davidflorida.com.


Click graphic to enlarge September 2019 Infographic.
Home Showings Lead to Increased Sales
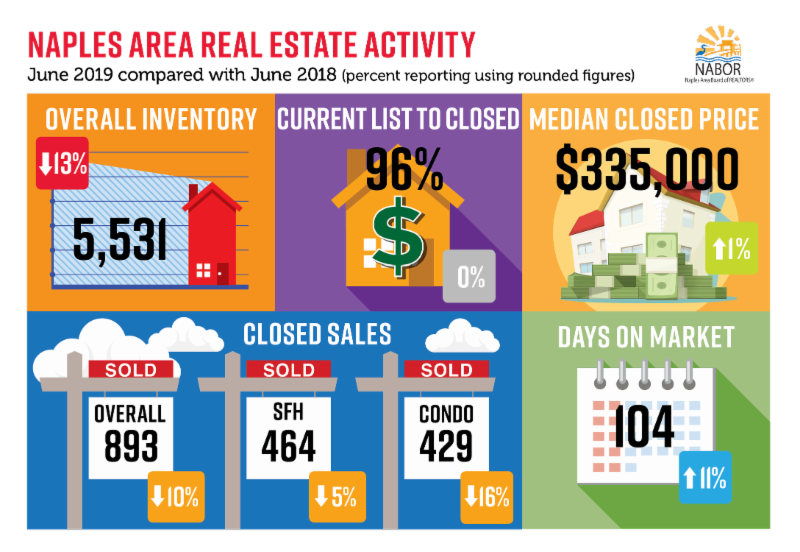
Naples, Fla. (October 25, 2019) – The Naples area housing market enjoyed another 7 percent increase in overall closed home sales for the third month in a row. This trend leads a Broker to suggest that the consistent uptick in summer home sales illustrates that Collier County is becoming less seasonal.
According to the September 2019 Market Report released by the Naples Area Board of REALTORS® (NABOR®), which tracks home listings and sales within Collier County (excluding Marco Island), showings in September 2019 were up 31 percent over September 2018. This translated into a 13.7 percent increase in pending sales (written contracts) or 823 pending sales in September 2019 compared to 724 pending sales in September 2018. Strong showing activity during the summer resulted in 698 closed sales during September 2019.
The September report showed median closed prices remained stable during the third quarter (July, August & September). In July, the median closed price was $326,400. By September, the median closed price had dropped slightly to $325,000, which is only a .7 percent decrease from September 2018, which reported a median closed price of $327,408. Interestingly, the median closed price in January 2019 was $325,000.
With over 500 listings pulled from the MLS in September, it is no surprise that overall inventory for the month fell. However, even though it decreased 17.8 percent to 4,989 homes compared to 6,070 homes in September 2018, inventory for September was higher than August by 72 homes.

The NABOR® September 2019 Market Reports provide comparisons of single-family home and condominium sales (via the Southwest Florida MLS), price ranges, and geographic segmentation and includes an overall market summary. NABOR® sales statistics are presented in chart format, including these overall (single-family and condominium) findings:
|
CATEGORIES
|
SEPT 2018
|
SEPT 2019
|
CHANGE
|
|
Total closed sales (month/month)
|
651 |
698 |
+7.2% |
|
Median closed price (month/month)
|
$327,408 |
$325,000 |
-0.7% |
|
Total active listings (inventory)
|
6,070 |
4,989 |
-17.8% |
|
Average days on market
|
93 |
102 |
+9.7% |
|
Single-family closed sales (month/month)
|
321 |
359 |
+11.8%
|
|
Single-family median closed price (month/month)
|
$395,000 |
$405,000 |
+2.5% |
|
Single-family inventory
|
3,208 |
2,567 |
-20.0% |
|
Condominium closed sales (month/month)
|
330 |
339 |
+2.7% |
|
Condominium median closed price (month/month)
|
$242,250 |
$245,000 |
+1.1% |
|
Condominium inventory
|
2,862 |
2,422 |
-15.4% |
As noted by brokers reviewing the housing data, September had a 6-month supply of inventory.
Geographically, condominiums in South Naples (34112, 34113) saw a 22.1 percent spike in its median closed prices to $213,000 in September 2019 from $174,500 in September 2018. Alternately, condominiums in North Naples saw a 16.4 percent decrease in median closed prices to $242,500 in September 2019 from $290,000 in September 2018.


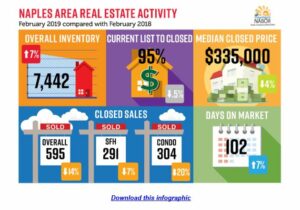 Home buyers had many more options to choose from in February as housing market inventory increased 7 percent to 7,442 homes in February 2019 compared to 6,912 in February 2018. In addition to 1,498 new listings added to the Southwest Florida MLS in February, the February 2019 Market Report released by the Naples Area Board of REALTORS®, which tracks home listings and sales within Collier County (excluding Marco Island), also reflected a 4 percent decrease in the overall median closed price to $335,000 in February 2019 compared to $350,000 in February 2018.
“This is typically the time of year when we see inventory jump,” said a local Broker. “New listings increased 34 percent in the single-family home market and 7 percent in the condominium market [based on a comparison of February statistics]. That’s a lot of great new options for buyers!”
The February Market Report showed inventory for each home type was about even in February with 3,801 single-family homes available (a 10 percent increase compared to February 2018) and 3,641 condominiums available (a 4 percent increase compared to February 2018).
While there were 100 fewer closed sales in February 2019 compared to closed sales in February 2018 (a 14 percent decrease), the added inventory has broker analysts convinced that buyers are not rushing into a sale like many did when inventory levels were much lower; and instead, are meticulously evaluating all their options that include new and existing homes.
The average days on the market increased in February, which tells me that buyers are looking at more homes before they make an offer. Plus, there is a lot more new construction this year than a year ago. Agents were rarely in the office in February because showings really increased dramatically.
Unlike many Florida markets, sales of homes in Naples are very geographically influenced. Historically, the closer a property was to the beach, the faster it would sell. But that’s not always the case anymore. Days on market were the lowest in the South Naples area (34112, 34113) in February; yet prices for single-family homes in this geographic area decreased 25 percent to $420,000 in February 2019 from $560,000 in February 2018.
“Our statistics show that the closed prices of properties that were sold in February averaged 95 to 96 percent of the current list price,” Brenda Fioretti, Managing Broker at Berkshire Hathaway HomeServices Florida Realty. “This shows that once a property is priced to attract buyers, the seller can realize a final closing price within 4 to 5 percent of asking price.”
Fioretti added that “many of the current listed properties are priced in excess of the range that is attracting buyers so sellers often have to reduce their asking price to the point where buyers are interested, looking and ready to make an offer. Pricing a home appropriately from the start helps the seller realize a much shorter marketing time and makes for a smoother transaction.”
I help buyers find the right homes at the right price in the right area faster because I understand how each geographic area and the neighborhoods within them are different. For example, closed sales of single-family homes near the beach decreased in February compared to a year ago while its median closed price increased; but closed sales of single-family homes increased in the South Naples area during February and its median closed price fell.
The high-end market continues to do very well in our area, Those high-end sales are usually made by very astute buyers and if the economy was bad or on a path to becoming bad, then they wouldn’t be buying as they are currently.
You can’t look at our market with only one lens, a lot can change in a quarter mile. Sellers are best served when they work with a REALTOR®, whose job is to offer home buyers and sellers a good understanding of neighborhood market trends and comparative pricing strategies. This is very important during high season, and especially today, when buyers have more housing options.
If you are looking to buy or sell a home in Naples, I have the experience and knowledge to provide an accurate market comparison or negotiate a sale. A REALTOR® can ensure your next purchase or sale in the Naples area is a success. Search for your dream home and find a Naples REALTOR® on Naplesarea.com.
It would be my honor to serve the real estate needs of you and your friends and family. Please contact me, David Critzer for additional information, and to arrange to view homes, call 239-285-1086 or email david@davidflorida.com.

2018 Year End
NABOR® Year End 2018 Market Report was Good for All!
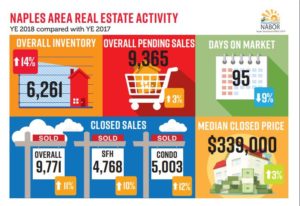
The Naples area housing market ended 2018 with impressive annual activity statistics in all areas of the residential real estate market including an 11 percent increase in total closed sales and a 14 percent increase in inventory compared to 2017. Sales of homes over $1 million continued to drive the market in 2018, especially in the condominium market where closed sales of condominiums over $1 million increased 37 percent! According to the Year End 2018 Market Report released by the Naples Area Board of REALTORS® (NABOR®), which tracks home listings and sales within Collier County, inventory at the end of 2018 was the highest on record in six years.
“Prices held steady in 2018 with just a 3 percent increase in median closed price,” said Brenda Fioretti, Managing Broker at Berkshire Hathaway HomeServices Florida Realty. “However, for homes over $300,000, the median closed price actually decreased 1 percent.”
Upon reviewing the YE 2018 Market Report, Fioretti concluded that there are many positive trends for both home buyers and sellers in 2019. The top 5 positive trends for home buyers and sellers are:
5 POSITIVE TRENDS FOR SELLERS
- Colder winters up north are bringing more visitors to the Naples area
- Naples area homes are selling faster (average days on market decreased 9 percent from list to closing)
- Buyers interest in the Naples market is on the rise as a result of aggressive builder advertising in northern markets
- More comparable home prices are available with the increase in inventory
- Location, location, location continues to appeal to home buyers
5 POSITIVE TRENDS FOR BUYERS
- Inventory is increasing which translates to more options for home buyers
- There are as many condos for sale as there are single family homes which expands overall opportunities for home buyers (Total: 6,261)
- The stability of the overall median closed price builds buyer confidence in the market
- Mortgage interest rates are currently low (<5%) spurring home buying decisions
- Location, location, location continues to offer appeal!
Single-family homes in the Naples Beach area reported the highest median closed price increase (14 percent) in 2018 compared to 2017. But that’s most likely due to closed sales of a few multimillion homes that took place last year including a $48.8 million transaction in June for a home in Port Royal.
The median closed prices listed on NABOR®’s market reports do not reflect average sales prices. Rather, the median closed price demonstrates a rate wherein half the closed sales were purchased for amounts below the figure (median) and half the sales were purchased for prices above it. As such, of the 662 single-family homes located in the Naples Beach area that sold in 2018, the median closed price was $1,268,000 in 2018 compared to the 652 single-family homes that sold in 2017 where the median closed price was $1,117,000. Incidentally, closed sales in this area increased only 2 percent.
Conversely, closed sales of single-family homes in the Ave Maria/Immokalee area increased 233 percent to 143 homes in 2018 compared to 43 single-family homes in 2017. Median closed prices for single-family homes in the Ave Maria/Immokalee area decreased 4 percent to $245,000 in 2018 compared to $255,000 in 2017.
According to a local Broker, many small builders are listing their newly constructed homes on the Southwest Florida MLS (multiple listing service), which is reflected in the increased inventory statistics in all price points and in all geographic locations. “Inventory for single-family homes under $500,000 increased the most in 2018, which is good news for buyers who don’t necessarily require a home within walking distance of the beach. In fact, the highest increase in inventory for 2018 was 34 percent, and it appeared in the under $300,000 single-family homes category.”
While the Ave Maria/Immokalee area also reported the highest increase in single-family inventory (40 percent) among all geographic areas tracked, the single-family home inventory in Central Naples increased 38 percent to 391 homes in 2018 from 283 homes in 2017.
As pointed out by another local Broker, the 3 percent increase in overall pending sales for 2018 concerned him at first as it looked too low compared to activity in other areas of the report. However, after much discussion with several broker analysts also reviewing the annual market report , it was determined that, the smaller-than-expected increase was because many closings for a large percentage of homes under contract in the 4th quarter of 2017 were delayed while repairs from Hurricane Irma damage took place.
The NABOR® Year End, 4th Quarter and December 2018 Market Reports provide comparisons of single family home and condominium sales , price ranges, and geographic segmentation and includes an overall market summary. NABOR® sales statistics are presented in chart format, including these overall Year Ending 2018 (single-family and condominium) findings:
CATEGORIES YE 2017 YE 2018 CHANGE (percentage)
- Total homes under contract (pending sales) (year/year) 9,121 9,365 +3
- Total closed sales (year/year) 8,815 9,771 +11
- Median closed price (year/year) $330,000 $339,000 +3
- Median closed price >$300K (year/year) $514,000 $510,000 -1
- Total active listings (inventory) 5,491 6,261 +14
- Average days on market 104 95 -9
- Single-family closed sales (year/year) 4,347 4,768 +10
- Single-family median closed price (year/year) $418,000 $425,000 +2
- Single-family inventory 2,685 3,131 +17
- Condominium closed sales (year/year) 4,468 5,003 +12
- Condominium median closed price (year/year) $263,000 $265,000 +1
- Condominium inventory 2,806 3,130 +12
Even though the Southwest Florida MLS system is not as widely used by REALTORS® working in commercial real estate in Naples, the data collected does help agents gauge this sector of the market. According to a local Broker, “Vacancy rates for commercial properties are low right now. I’m seeing most vacancy rates well under 5 percent.”
Historically, commercial real estate activity is directly affected by the residential real estate market. When nearly 1,000 more homes are sold annually compared to a previous year, as was the case between 2017 and 2018, it is realistic to expect the number of businesses will increase to meet the needs of those new consumers. Dozens of new commercial properties are in various stages of development across Collier County, many of which have large grocery store anchors.
If you are looking to buy or sell a home in Naples, please contact me, I have the experience and knowledge to provide an accurate market comparison or negotiate a sale. It would be my honor to assist you and your friends and family with your real estate needs. Feel free to contact me anytime.
Best,
David
239-285-1086


