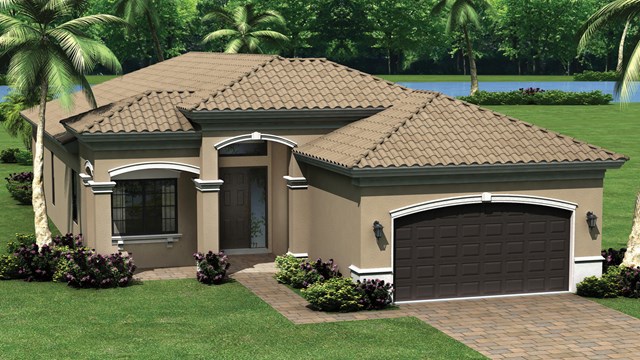
Burgundy model at Marbella Isles, Naples, Florida photo: GL Homes
Marbella Isles by GL Homes – New construction homes in Naples, Florida
Marbella Isles by GL Homes Burgundy model is roomy at 2,081 a/c sq. ft. · 2,869 total sq. ft., and features:
- 2 Bedrooms
- 2 Bathrooms
- Den
- Great Room
- Screened and Covered Patio
- 2-Car Garage
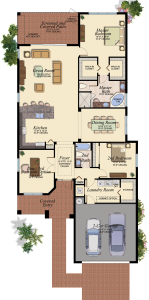
Floorplan: Burgundy model at Marbella Isles, Naples, Florida photo: GL Homes
When you live at Marbella Isles, you’ll enjoy so much more than a gorgeous new home in Naples, Florida. A beautiful gated entry and an enclave of world-class amenities promise luxury living. The 9,500 a/c sq. ft. clubhouse offers a social hall, a fully-equipped fitness center, indoor sports court, game room, multi-purpose room and more. Step outside and you’ll find even more amenities at the lifestyle complex. A resort-style pool, tennis, bocce, and a party pavilion are just a glimpse of all that awaits at this incredible new community.
You can expect all this and so much more at Marbella Isles, the perfect destination for a new home in Naples, Florida. — GL Homes


photo: Del Webb homes
If you’re lucky enough to have found your “happy place”—that magical destination you return to year after year to get away from the hustle and pain of everyday life—you’ve probably at least considered what it would be like to make the arrangement more permanent. You’ve given some serious thought to the enticing concept of buying a vacation home rather than renting one.
You’d have plenty of company. Vacation home sales soared to 1.13 million in 2014, according to the National Association of Realtors®. That’s the highest level since the NAR began the survey in 2003, and a 57% increase from 2013.
Just because buying a vacation home sounds like a dream, however, doesn’t mean that it would be one. Answer these questions to see whether it makes sense for you, or whether renting is the way to go.
- Can you really afford it?
- How often will you actually use the property?
- Are you really going to rent it out?
- What’s your long-term plan?
Read the entire article on realtor.com

 naplesnews.com by Jospeh Cranney | January 16, 2016
The small stretch of Third Avenue South that recently opened as the first phase of a major downtown development project looks, as City Councilman Sam Saad put it, like “the ideal” street design.
The avenue has sidewalks, bike lanes, two traffic circles and 28 new parking spaces. It is brick paved, which the city says is better for storm water management. And other elements, such as palm trees and decorative fountains, add to the streetscape.
The avenue helps downtown traffic flow east to Goodlette-Frank Road and also provides access to the Bayfront shopping and dining complex.
The design of the avenue was approved by Naples City Council in 2013, part of one of the largest development projects in the city’s history. The project, called Naples Square, will include four residential buildings, each with 75 units, and a yet to- be determined amount of commercial space.
Read the complete article here.

Dartmouth floorplan at Naples Square, Naples Florida new construction condos

 From realtor.com by Yuqing Pan | January 11, 2016
To figure out which of these towns were drawing would-be buyers, we aggregated page view data on realtor.com® in December 2015 to pinpoint where people are actually checking out houses online. With the homes in Hawaii and Southern California busting most people’s budgets, all eyeballs are now on the Sunshine State.
The housing market in Southwest Florida has been red-hot for the past few years, but Sarasota (No.1) is getting blistering.
Here’s the full list and median list prices:
Hottest waterfront real estate markets
Sarasota, FL: $339,000
Naples, FL: $479,000
Myrtle Beach, SC: $168,950
Delray Beach, FL: $248,950
Vero Beach, FL: $309,000
Miami Beach, FL: $569,000
Jupiter, FL: $489,000
Lake Worth, FL: $210,000
Venice, FL: $265,000
Palm Harbor, FL: $235,000
Of course, coastal communities vary as widely as the people who vacation in them. That’s why we crunched the numbers further to come up with the top 10 beach towns for four types of vacationers (Best Outdoor Activities, Cleanest Water, Best Weather, Nightlife). So slip on the Havaianas, slather on some SPF 50, and let’s get to the beach!
Read the complete article here.


A broad sugar sand beach awaits your footprints in Park Shore area of Naples, Florida.
RISMEDIA, Saturday, December 19, 2015— For the first time since 2001, Florida, our nation’s 27th state, is back on top as Americans’ most desired habitation destination. When asked where – excluding their current state – they would most like to live, The Sunshine State is at the top of the list. Sunshine and waterfront acreage are consistent themes at the top of this list, with California (2) and Hawaii(3) rounding out the top three. Turning away from beachfront territories, Colorado (4) and New York (5) close out the top five states Americans would like to live in.
These are some of the results of The Harris Poll of 2,232 U.S. adults surveyed online between November 11 and 16, 2015. Full results of this study, including data tables, can be found here.
Despite some re-ordering, this year’s top five were, for the most part, also top-five honorees in 2013 (the last time this question was asked); the sole exception is New York, which edged into the top-five after a sixth place showing last time around. Texas, meanwhile, drops out of the top five and into 6th place this year.
The remaining 9 states on the “top 15” list include diverse geographies, though most do fall within a few general categories:
- The coasts are well-represented: Along with Florida, the Carolinas – North (7) and South (12) – and Georgia cover most of the southeastern United States beachfront. Meanwhile, Oregon (9) and Washington (14) make for full west coast coverage (when combined with California);
- Perhaps for some it’s not the coast but the warmth which takes precedence, as landlocked-but-sunny states Arizona (8) andTennessee (10) also make the list;
- Hawaii’s partner in non-contiguity (though its opposite on the size and weather spectrums), Alaska (11), makes an appearance; and
- Pennsylvania (15) represents the mid-Atlantic while rounding out the top 15.
Of course, many states have both admirers and detractors. California may be 2nd on the list of states Americans would like to live in, but it also tops the list of states where Americans would least like to dwell. New York and Alaska may both be top 15 performers when Americans say where they would like to live, but they also round out the top three states where Americans would not want to live (2 and 3, respectively). Mississippi (4) and Texas (5) complete the top 5 for the dubious list, with Alabama (6), Florida (7), Illinois (8), Michigan(9) and the District of Columbia (10) completing the top 10.
Favorite and Least Favorite Cities
Focusing in on cities Americans would (and wouldn’t) want to live in, Americans continue their love/hate relationship with The Big Apple. New York, N.Y. has topped The Harris Poll’s list of cities where Americans most want to live (excluding where they live now) for well over a decade, but it has also topped the list of cities they’d least like to live in since the question was first asked in 2010.
California and Florida are well represented among the top 10 most desired cities, with San Diego, Los Angeles and San Francisco nabbing the 2nd, 4th and 6th spots for the Golden State, while Miami and Orlando bring the 5th and 10th spots home to the Sunshine State.
Denver, Colo. (3) fills in the lone gap in the top five, while Honolulu, Hawaii (7); Atlanta, Ga. (8) and Seattle, Wash. (9) fill out the rest of the top 10.
The top three cities Americans would least want to live in have remained the same since this question was first asked in 2010, with the aforementioned New York, N.Y. at the top, followed by Detroit, Mich. (2) and Los Angeles (3). Chicago, Ill. repeats in 4th place, while Dallas, Texas (5) rounds out the top five. Miami, Fla. (6); San Francisco, Calif. (7); Houston, Texas (8); Washington, DC (9) and Las Vegas, Nev. (10) complete this less desirable top 10 list.
For more information, visit www.TheHarrisPoll.com.

 Naples, Fla. (December 18, 2015) – The November 2015 Market Report released by the Naples Area Board of REALTORS® (NABOR®), which tracks home listings and sales within Collier County (excluding Marco Island), showed many performance similarities to the same report from November 2014. And those similarities left broker analysts who review the report with a sense of satisfaction because they predicted a continuation of market stability in November 2014. If history is any indication of future performance, then activity reflected in the November 2015 Market Report may indicate a market that is poised to enjoy stable activity in the coming months.
“The only big difference between November 2014 and November 2015 was inventory,” said Brenda Fioretti, Managing Broker at Berkshire Hathaway HomeServices Florida Realty, who went on to add that overall inventory in November 2015 increased in three of the five price segments reported. “Overall inventory decreased by 1 percent from 4,136 homes in November 2014 to 4,095 homes in November 2015. But this is compared to a 10 percent decrease in inventory from November 2013 to November 2014. And yet the report indicated inventory is on the rebound in the single-family home market, which showed a 5 percent increase from 2,217 homes in November 2014 to 2,319 homes in November 2015.”
Fioretti also pointed out that overall closed sales for 12-months ending November 2015 reflected nearly the same number of sales as 12-months ending November 2014. Overall closed sales increased 1 percent from 9,724 homes in the 12-months ending November 2014 to 9,800 homes in the 12-months ending November 2015. Interestingly, closed sales in the 12-months ending November 2013 to November 2014 dropped 2 percent.
Overall pending sales for all price categories above $300,000 increased in November 2015, with the $1 million to $2 million price category showing the largest growth at 27 percent from 45 homes in November 2014 to 57 homes in November 2015.
“Homes under $300,000 are going fast,” said a local Broker/Owner. “Days on market for that segment dropped 11 percent from 57 to 51 days, which doesn’t leave a lot of time for serious buyers to shop around.”
In response, a local Broker, recommended buyers that are looking in this price category should “move faster when submitting an offer to get ahead of other potential buyers that might be looking at the same property. With a declining inventory pool in the low end, there appears to be no shortage of buyers for the properties under $300,000. Competition is coming from first time homebuyers, boomerang buyers and retirees living on a fixed income. The low end is also popular with investors.”
Overall inventory in the $300,000 and below price segment decreased 20 percent from 1,372 homes in November 2014 to 1,103 homes in November 2015. Yet since November 2013, inventory in this price segment has dropped 42 percent from 1,917 in November 2013 to 1,103 in November 2015. This segment also represented 50 percent of all closed sales in the 12-months ending November 2015.
“Foreclosures are the lowest they’ve ever been since NABOR® began tracking activity,” said a local Broker. “There were only 34 foreclosures and 8 short sales reported last month.”
The NABOR® November 2015 Market Report provides comparisons of single-family home and condominium sales (via the Southwest Florida MLS), price ranges, and geographic segmentation and includes an overall market summary, including these overall (single-family and condominium) findings:
- Overall pending sales decreased 3 percent from 825 homes in November 2014 to 804 homes in November 2015.
- Overall closed sales increased 1 percent from 9,724 homes in the 12-months ending November 2014 to 9,800 in the 12-months ending November 2015.
- Closed sales for single-family homes in the $300,000 to $500,000 price category increased 23 percent from 1,163 single-family homes in the 12-months ending November 2014 to 1,430 single-family homes in the 12-months ending November 2015.
- Closed sales for condominiums in the $300,000 to $500,000 price category increased 32 percent from 734 condominiums in the 12-months ending November 2014 to 968 condominiums in the 12-months ending November 2015.
- Overall median closed price increased 15 percent from $265,000 in the 12-months ending November 2014 to $305,000 in the 12-months ending November 2015.
- Overall median closed price for homes $2 million and above increased 10 percent from $2,950,000 in the 12-months ending November 2014 to $3,250,000 in the 12-months ending November 2015.
- Overall inventory decreased 1 percent from 4,136 in November 2014 to 4,095 in November 2015.
Single-family home inventory increased 5 percent from 2,217 single-family homes in November 2014 to 2,319 single-family homes in November 2015.
- There is a 5 months supply of inventory.
- Average days on market decreased 1 percent from 78 days in November 2014 to 77 days in November 2015.
The November 2015 Market Report showed days on market for the $2 million and above price category increased 124 percent from 99 days in November 2014 to 222 days in November 2015. Inventory in this category also increased by 21 percent from 401 homes in November 2014 to 484 homes in November 2015.
Days on market for all other price categories decreased. However, days on market by geographic location were more varied as shown in areas like Naples Beach and North Naples, which both saw increases over 20 percent.